Waking up in a pandemic
Baseform’s online software tracks data from water utilities around the world. Water flows, which most utilities monitor on a minute-by-minute basis, are a very direct proxy for human presence and human behavior.
We’ve been looking into a large chunk of such data to understand how people’s habits have changed under stay-at-home orders and, in particular, understanding how sleep and wake-up routines have been changing over time.
What we are observing is that wake-up times immediately shifted as soon as lockdown began. More interestingly, as time went on and people adapted to stay-at-home, wake up times have been steadily increasing: from initially waking up 30 minutes later than usual, all the way to 2h30 and above.
We’ve selected 1,000 independent water distribution networks from Portugal, Spain, Northern Europe and the USA, each supplying from 100 to 50,000. The total population covered is 3.5 million.
As each network supplies a mixture or residential, commercial, services and industry consumers, each one contains a particular water demand pattern that changes in time. It is similar to a fingerprint where there are both commons elements and particular individual characteristics.
Water, as opposed to power, gas or other utilities’ data, is nearly 100% driven by human presence and human activities. Network demand pattern tend to be very predictable, in particular reflecting habits such as the time of of day when night-time flow, when everyone is asleep, shifts to wake-up-flows, a sharp increase leading to a morning peak, as people use the bathroom, shower, prepare breakfast and open up businesses.
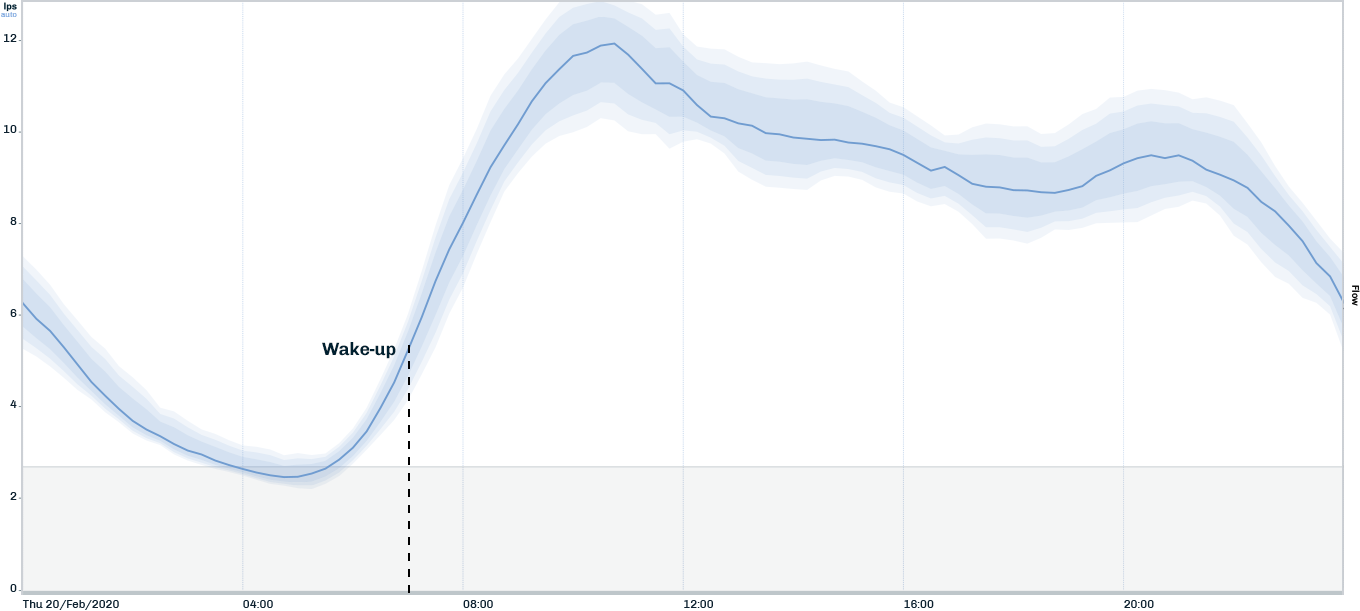
Example of a demand pattern, the center blue line represents normal behavior and the shaded areas are the uncertainty around each particular time of day
For each one of the selected networks, the software analyzed the flows at a reference period, previous to the COVID-19 pandemic, determining the normal wake-up time for each day of the week. These times change from country to country and from one zone to the other, centering at 7am for weekdays. One factor that correlates directly with it is the average travel time to work as obtained by the US Census Bureau.
Then, every day since the beginning of March, the software has been tracking the difference between pre-pandemic wake-up times and the current ones.
The actual date when stay-at-home orders, education and non-essencial facilities closed is immediately perceptible; wide variations can be observed as not only national and local policies have differed but also businesses or facilities differ in the way they have complied.
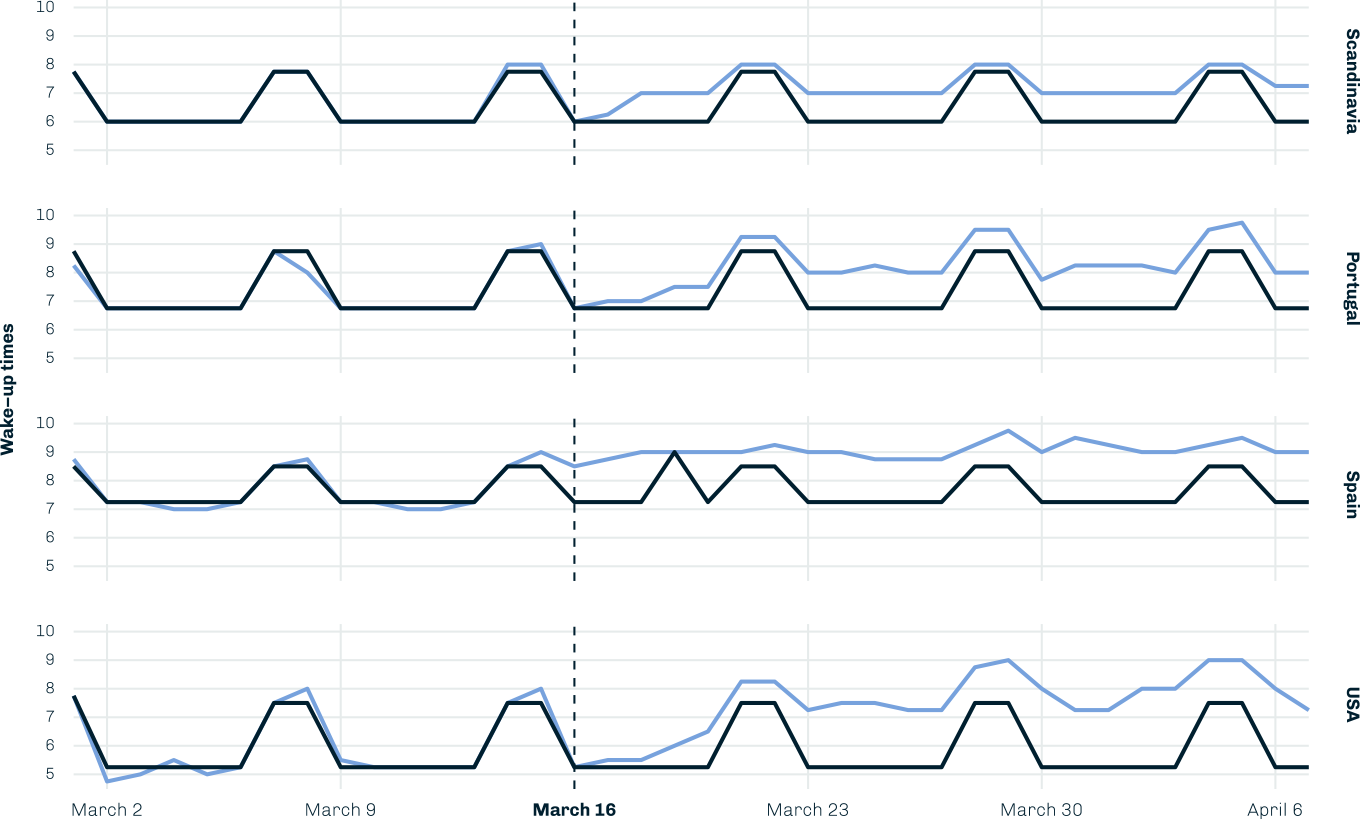
Wake-up times before (black) and after (blue) stay-at-home orders in four regions
As we kept tracking this, what stands out is a continuous, steady increase in the change of behavior. On the first day data shows a +30 minute variation, which grows to +1h15 after three weeks, being as high as +2h30 in many areas.
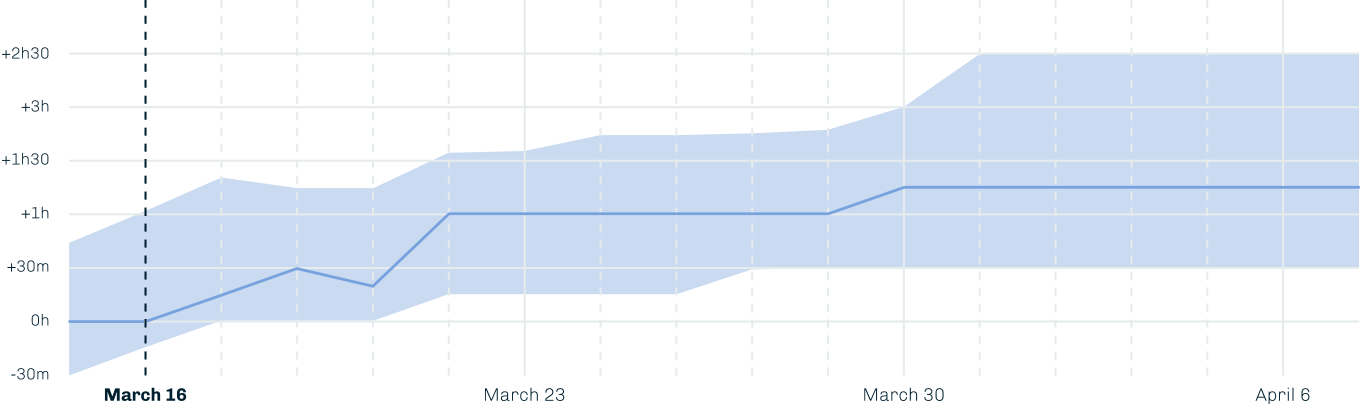
Changes in Current vs. pre-Covid19. The center line represents the average variation and the shaded areas show higher and lower percentiles across the 1,000 water network data set
There might be a number of factors explaining this increase, from the proportion of people complying with the policy, to progressively more stringent measures over time. Wider-ranging social adaptation may be at play as well, with an influence of the accumulation of the amount of time we stay at home in our sleeping habits, or progressive adaptation of family routines and telework settling into new habits.
We’ll continue to post what we learn as we go deeper in trying to assist our client utilities in understanding and adapting to the changes.
[this article was originally published on medium by Diogo Vitorino, Baseform's CTO]