Same CCTV effort, 5x more critical sewers found
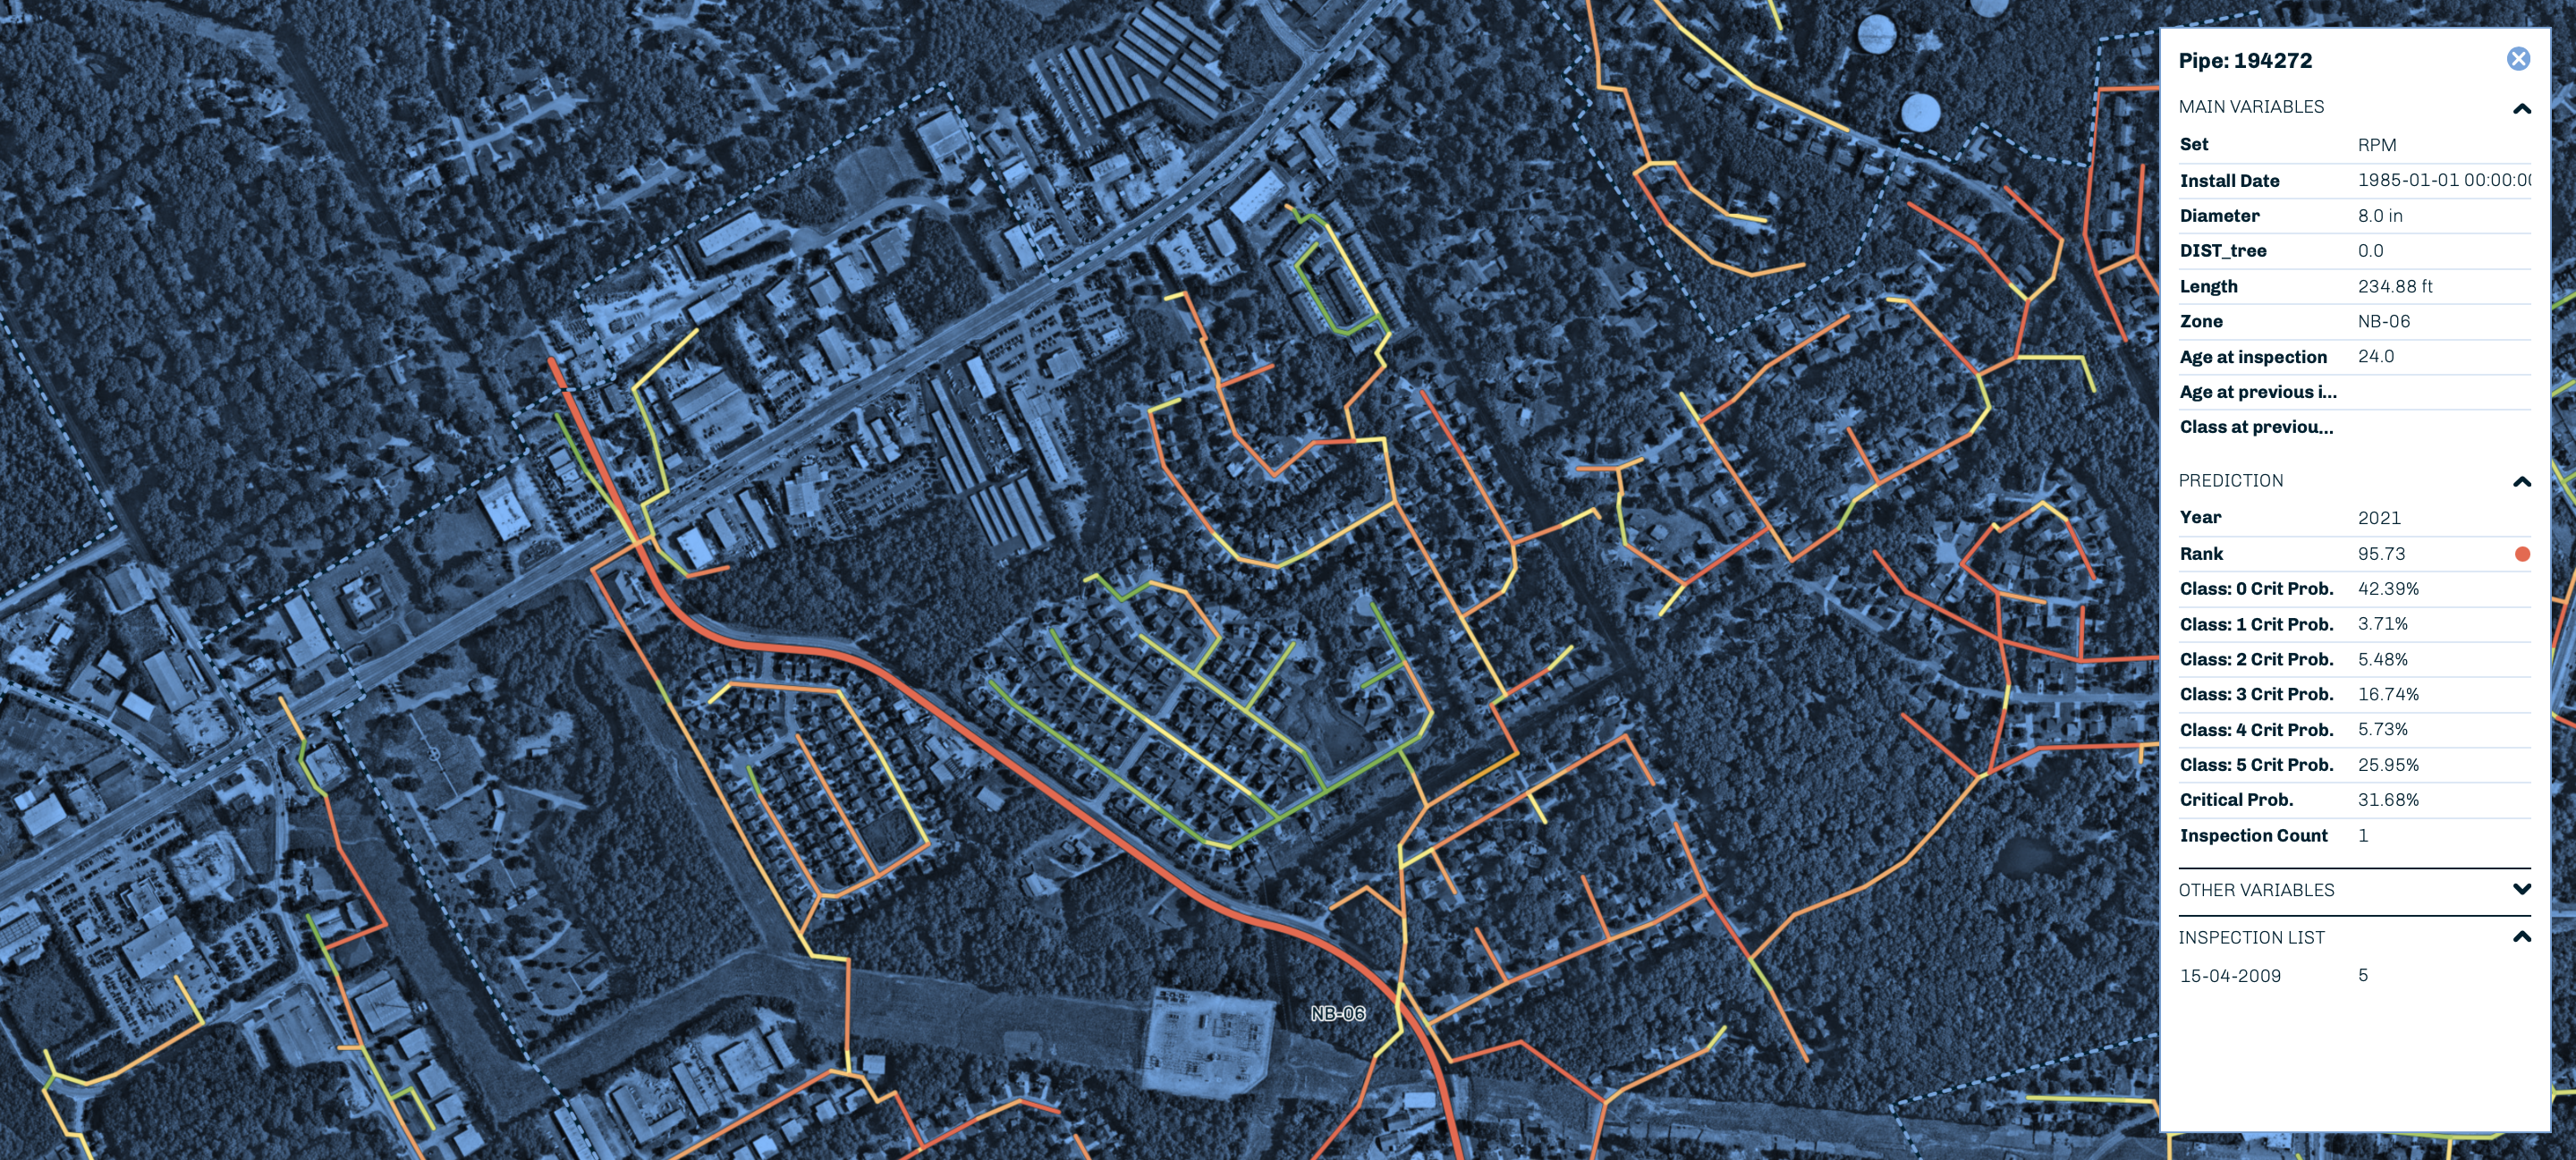
Using existing CCTV inspections together with GIS and contextual data to predict sewer condition across the enables pointing the next inspections to the most critical assets at any moment. This means large gains in ROI and speed of results.

This utility promotes a CCTV inspection program of sewers and manholes as part of their effort to manage infiltration& inflow (I&I) and SSOs, recover system capacity and prioritize network renewal.
Baseform’s Inspections Analysis module correlates CCTV inspections withGIS and other contextual data to predict the likely condition of uninspected sewers and manholes, or inspected at an earlier date.
In particular, it provides a running list of assets prioritized for inspection or for action at given moments, and a framework for planning and optimization of CCTV inspections.
The utility achieved a 60% reduction in CCTV annual cost without loss of efficiency in finding assets needing action (‘criticals’), directing and planning each new batch of inspections according to the software’s predictive capabilities.
This utility uses PACP categories 4 and 5 as ‘critical’, i.e., triggering protocols for deferred or immediate action, respectively.
The average success rate in finding critical sewers was close to 6% (6 out of 100 sewers), working from an annual budget of nearly $2M to stay within the defined strategic target for locating critical assets and controlling I&I and system deterioration.
Baseform’s predictive capability (see figure above) increased that success rate to 34%: i.e., 1 in every 3 inspected sewers is a 4 or a 5. This enabled the utility to:
- (i) fulfil their CCTV inspection target with a 60% cost reduction, or a savings of over $1.2M/year;
- (ii) develop specific deterioration curves based on own data, with much improved reliability for O&|M and renewal planning;
- (iii) revise the Asset Management plan to reflect the most recent deterioration curves and system-specific EUL (expected useful life) estimates.
Inspections prediction are further combined with Baseform’s failure event prediction to address SSOs, and the software’s flow monitoring and event detection to quantify I&I and home in on hotspots.
This 3-pronged approach leverages Baseform’s consolidated data platform where the diverse data sources are validated and reconciled, providing a consistent foundation for users across the utility.
Utility Profile
Population served: 936 250
# clients: 240 100
Total network length (water supply): 4,100 mi
Total network length (sewer system): 2,995 mi
Available data systems:
- GIS; gravity sewer system, pressure system
- CCTV inspections: records used since 2006
- Maintenance/work orders: records used since 2008
Focus of Baseform implementation:
- I&I management
- Proactive maintenance and CCTV inspection; planning/ optimization
- CIP planning (sewer system and WWTPs)
For further details, we will be pleased to provide utility contact information.
Data leveraged in this case
Baseform’s software is designed to take full advantage of the data that already exists in the utility, depending on each application objective.
The software connects to the available data systems in an automated, non-intrusive and completely secure manner.
In the case of this specific utility and the application described here, data from the systems highlighted below were used.
Data syncing and reconciling
Baseform's proprietary data syncing technology automatically reconciles the data continuously received from the multiple IT systems, georeferencing all features and filling in data gaps such as install dates or pipe materials.
We make it our business to deal with your data so that you can concentrate on the outcomes
Find out how Baseform can help your utility save water, time and money. Request a demo.